| |
Area dredged
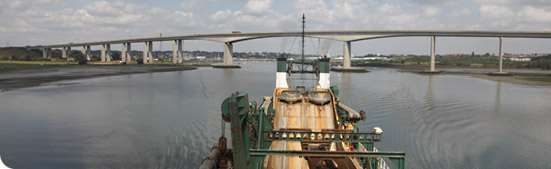
One of the most significant developments over the last two decades for the management of marine aggregate extraction operations has been The Crown Estate requirement that all vessels dredging on production licences be fitted with an electronic monitoring system (EMS). The EMS automatically records the date, time and position of all dredging activity, and this data is automatically sent to both The Crown Estate and the industry regulator on a monthly basis. The data is carefully analysed to ensure that all operations are taking place in accordance with the Marine Licences they are operating under. Analysis undertaken by The Crown Estate showed that a total of 18,344 hours of dredging activity were recorded by EMS systems during 2011, equivalent to approximately 55,000km of dredge track.
BMAPA and The Crown Estate are committed to transparency in reporting the area licensed for dredging at any time. In March 1999 both parties issued a joint statement of intent which committed to reviewing all production licence areas over a rolling five year period, surrendering areas no longer containing useful resources of sand and gravel. This included a commitment to publish an annual report detailing the extent of dredging within regional licensed areas using analysis of EMS data.
Every year since 1998, BMAPA and The Crown Estate have jointly produced an annual report known as the Area Involved, which detailed changes in the area of seabed licensed and dredged at both national and regional scales. In 2005, we published our first five-year review report which summarised the period 1998-2002 and this has been followed by three further reviews in 2009, 2014 and 2019, the most recent of which summarised the period 1998-2017.
| |
Area of seabed
licensed for
dredging (km2) |
Area available
to be worked
(km2) |
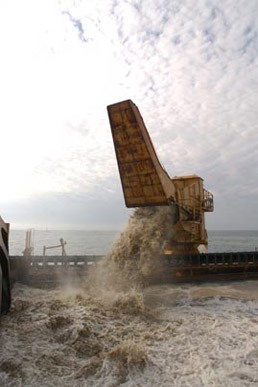
Area dredged
(km2) |
Quantity
dredged
(m tonnes) |
| 1998 |
1,458 |
|
222.6 |
20.47 |
| 1999 |
1,455 |
|
220.3 |
23.68 |
| 2000 |
1,464 |
|
155.4 |
20.68 |
| 2001 |
1,408 |
972 |
150.6 |
22.76 |
| 2002 |
1,359 |
896 |
149.8 |
21.93 |
| 2003 |
1,264 |
890 |
143.8 |
22.23 |
| 2004 |
1,257 |
780 |
134.5 |
21.45 |
| 2005 |
1,179 |
596 |
137.6 |
21.09 |
| 2006 |
1,316 |
576 |
140.6 |
24.18 |
| 2007 |
1,344 |
556 |
135 |
23.09 |
| 2008 |
1278 |
570 |
138 |
21.24 |
| 2009 |
1,286 |
536 |
124 |
20.10 |
| 2010 |
1,291 |
552 |
105 |
15.95 |
| 2011 |
1,274 |
567 |
114 |
19.12 |
| 2012 |
711 |
391 |
97 |
16.79 |
| 2013 |
723 |
332 |
99 |
16 |
| 2014 |
726 |
332 |
85.66 |
16.94 |
| 2015 |
932 |
337 |
82.67 |
18.82 |
| 2016 |
934 |
452 |
87.53 |
17.94 |
| 2017 |
1,057 |
552 |
90.94 |
19 |
| 2018 |
1,102 |
552 |
97.87 |
19.6 |
| 2019 |
1,079 |
579 |
105.12 |
22 |
| 2020 |
1,055 |
578 |
101.04 |
18 |
| 2020 |
1,068 |
550 |
106.35 |
21 |
| 2022 |
1,105 |
581 |
107.40 |
20 |
Area involved twenty-year review (1998-2017)
December 2018, BMAPA and The Crown Estate published a twenty-year review of the area involved initiative.
The review reports on trends across three key areas:
Area licensed:
- Between 1998 and 2017, the area of seabed licensed decreased by 401km2.
- 1,414km2 of licensed area was surrendered.
- 1,013km2 of new area was licensed.
- The area licensed within six nautical miles from the coast and between six and 12 nautical miles decreased. The greatest decrease occurred between six and 12 nautical miles. There was an increase in the area licensed beyond 12 nautical miles.
Area dredged:
- Between 1998 and 2017, the area of seabed dredged decreased by 132km2.
- The area of seabed dredged per year ranged from 223km2 in 1998 to 83km2 in 2015.
Cumulative Footprint:
- The cumulative area of seabed dredged between 1998 and 2017 amounted to 551km2. Of this total, 328km2 (60%) is within current licence areas and the remaining 223km2 (40%) is within areas which have now been relinquished.
- The area of new seabed dredged annually decreased significantly to only 11.06km2 a year in 2017. In 2002, this figure was 24.77km2. In 2007, it was 11.90km2 and, in 2012, it was 6.06km2.
- A total of 403 million tonnes of marine sand and gravel was dredged from The Crown Estate licence areas between 1998 and 2017. Averaged across the cumulative footprint, this represents 45cm of sediment being removed across the entire area dredged.
- In reality, the extraction activity will not be spread evenly across the dredged area, and some areas will be dredged more intensively while others may not be dredged at all. Consequently, the actual thickness of sediment removed per unit area will vary according to the intensity of dredging operations and the depth limits of the sand and gravel deposits being targeted. Nevertheless the relationship between dredged area and extraction tonnage provides an indicator of the relative scale of dredging intensity.
Area involved 25th annual report (2022)
Summary information from the 25th annual report, published in August 2023, is as follows. This relates to the 2022 calendar year (2021 equivalents in brackets).
- A total of 20 million tonnes of sand and gravel were dredged from Crown Estate licences in England and Wales during 2022 (compared to 21 million tonnes in 2020)
- The total area of seabed licensed in 2022 was 1,105km2 (1,068km2 in 2021)
- Dredging took place within 107 km2, 10 per cent of the licensed area, compared with 106km2 (10 per cent) in 2021
- The area of seabed dredged for more than 1 hour 15 minutes per year (high intensity – red on charts) was 7km2 (6km2 in 2021)
- 90 per cent of dredging effort from Crown Estate licences took place from an area of 44km2 (43km2 in 2021).
here.
|
|